Skip to content
Ljómi Systems

Products

Systems that translate
nature into sound

Each product uses computer vision to read a different part of the natural world and convert it into MIDI, ready for your DAW, modular synth, or live performance setup.

The products

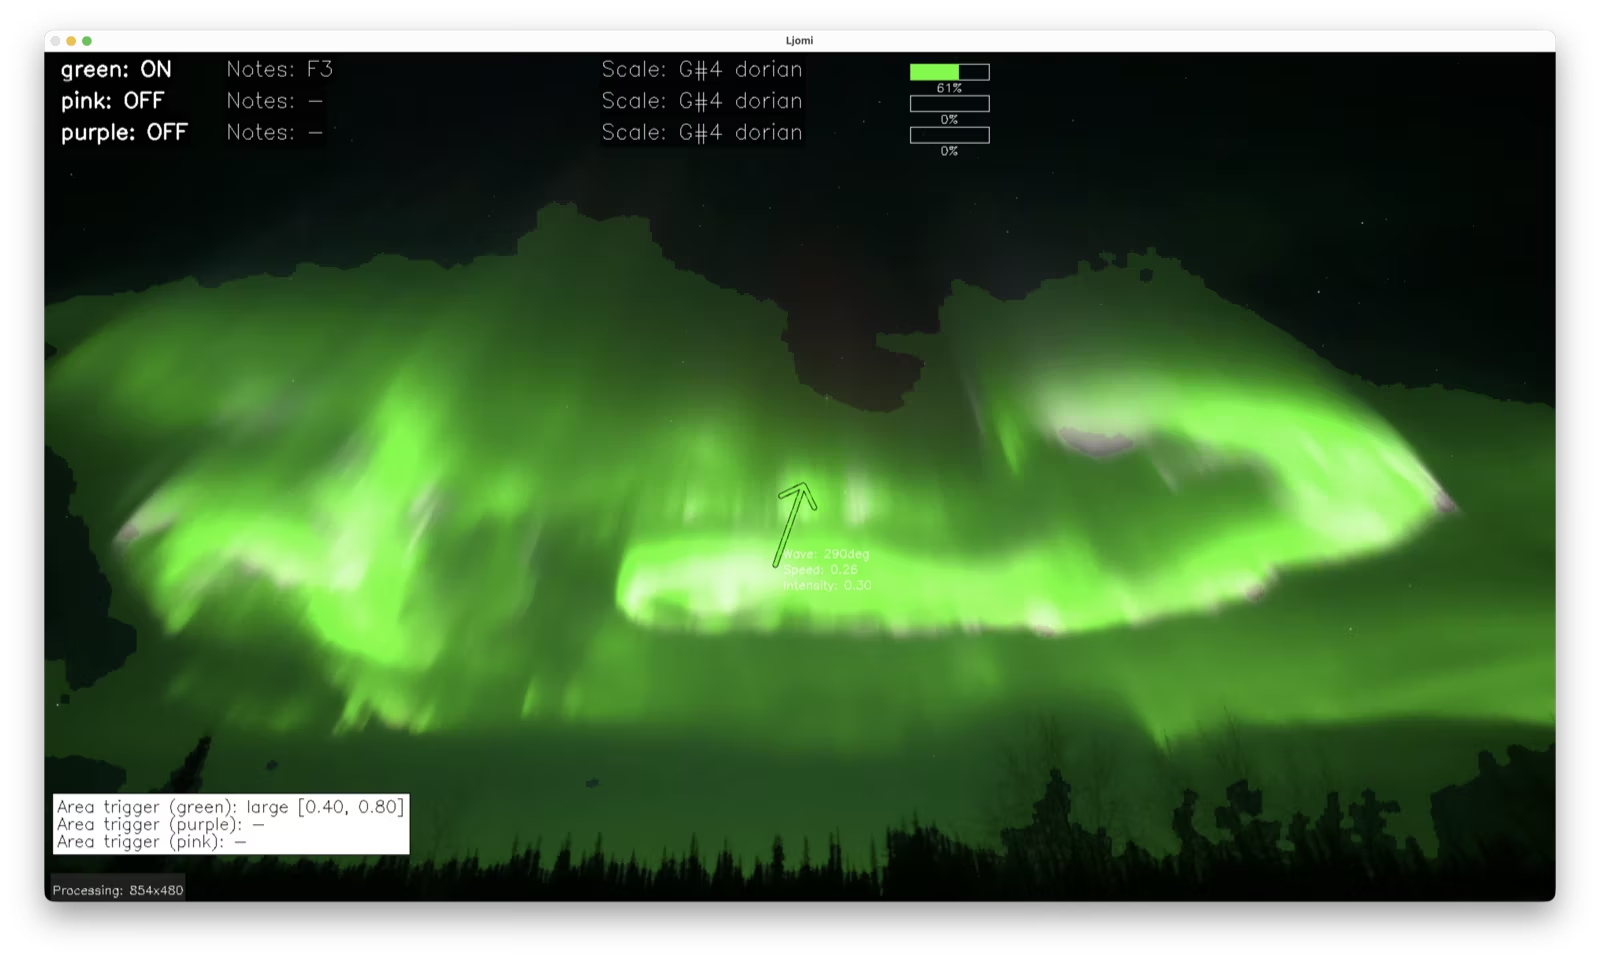
  • Ljómi reading aurora footage, with green, pink and purple channel readouts, note values and intensity meters overlaid on the sky.

    Ljómi

    In development

    Aurora to MIDI, in real time

    Our flagship system takes aurora borealis footage, live or recorded, and turns it into generative music over MIDI. It detects green, pink and purple aurora hues, reads intensity, movement, wave pattern and area coverage, then translates all of it into notes, chords and CC data.

    Key capabilitiesLjómi

    • Real-time aurora colour detection
    • Brightness-driven chord complexity
    • Configurable musical scales
    • Per-colour MIDI channel routing
  • MIDI For Trees showing note-labelled detection zones over a row of trees, with an amber movement vector drawn across them.

    MIDI For Trees

    Available now

    Forest scenes become musical data

    A real-time audio-visual system that picks out individual trees in a video feed using multi-scale computer vision, reads their movement through optical flow, and maps those patterns to MIDI events. Wind-swayed branches become melodies.

    Key capabilitiesMIDI For Trees

    • Multi-scale tree detection
    • Optical flow movement analysis
    • Apple Continuity Camera support
    • Live camera & video file input
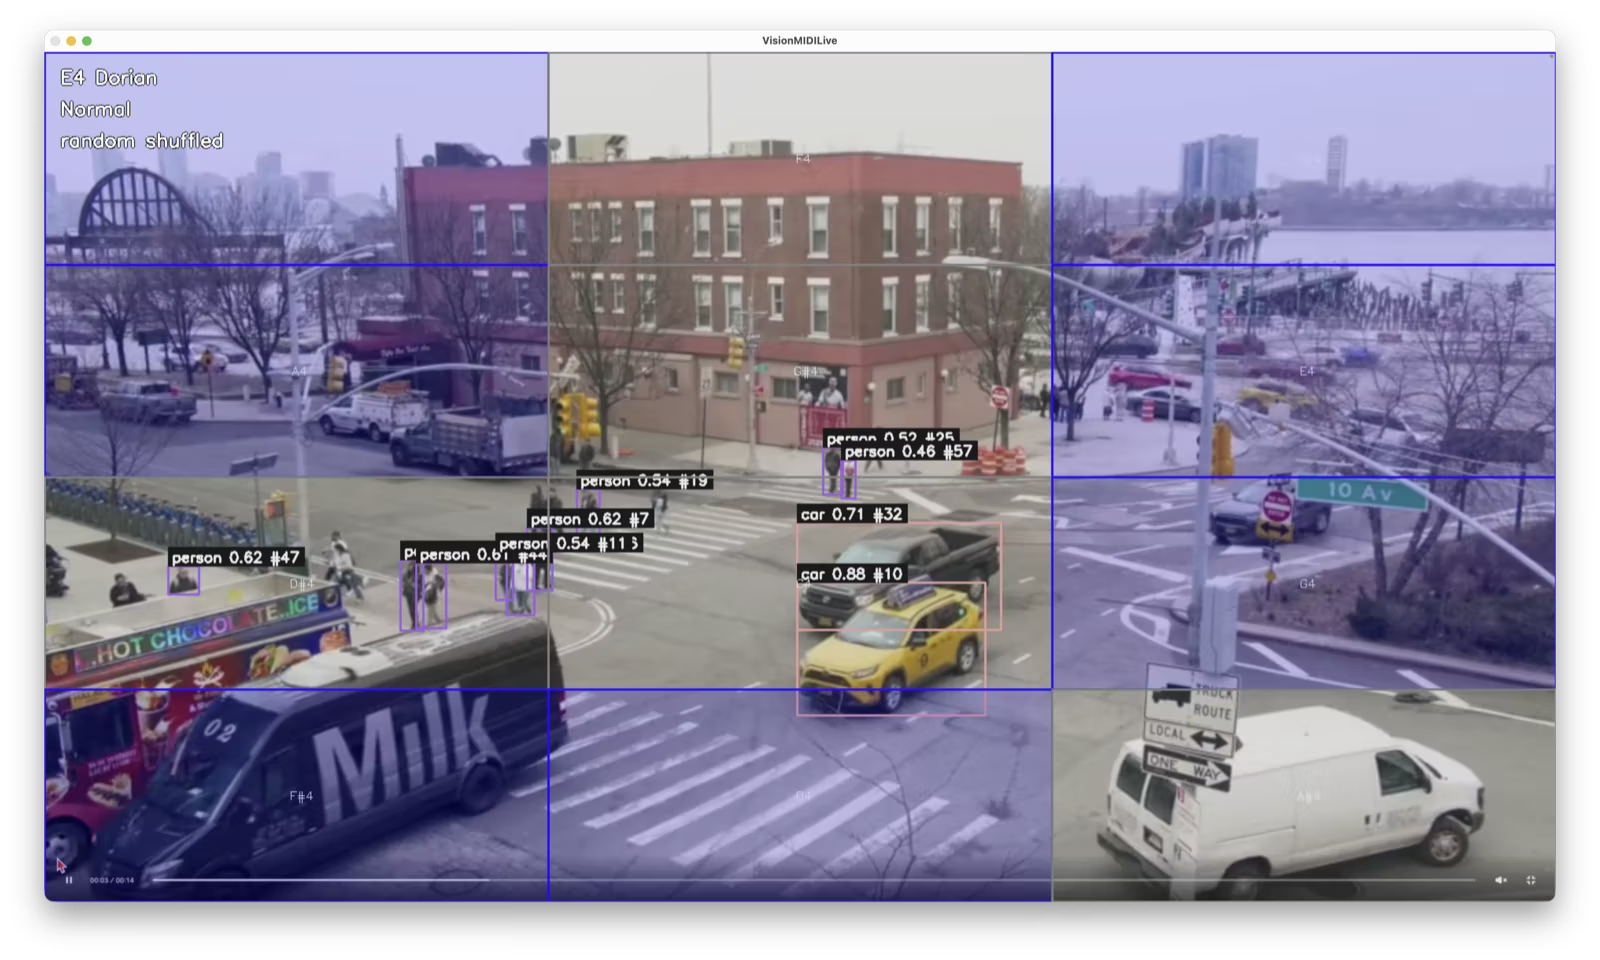
  • VisionMIDI Live overlaying a note grid on a street scene, with tracked detection boxes labelled person and car with confidence values.

    VisionMIDI Live

    In development

    Any scene, turned into music

    YOLOv11 object detection converts any video feed into music in real time. It maps each detected object to a note on a configurable virtual piano overlay, and tracks objects between frames so the output stays coherent as the scene changes.

    Key capabilitiesVisionMIDI Live

    • YOLOv11 real-time object detection
    • Dynamic musical translation
    • Universal scene compatibility
    • Virtual piano overlay

Other sonification projects

Smaller experiments, same principle

Four further projects, built to hear datasets and shapes rather than scenes. They have no product pages of their own, so everything about them is here.

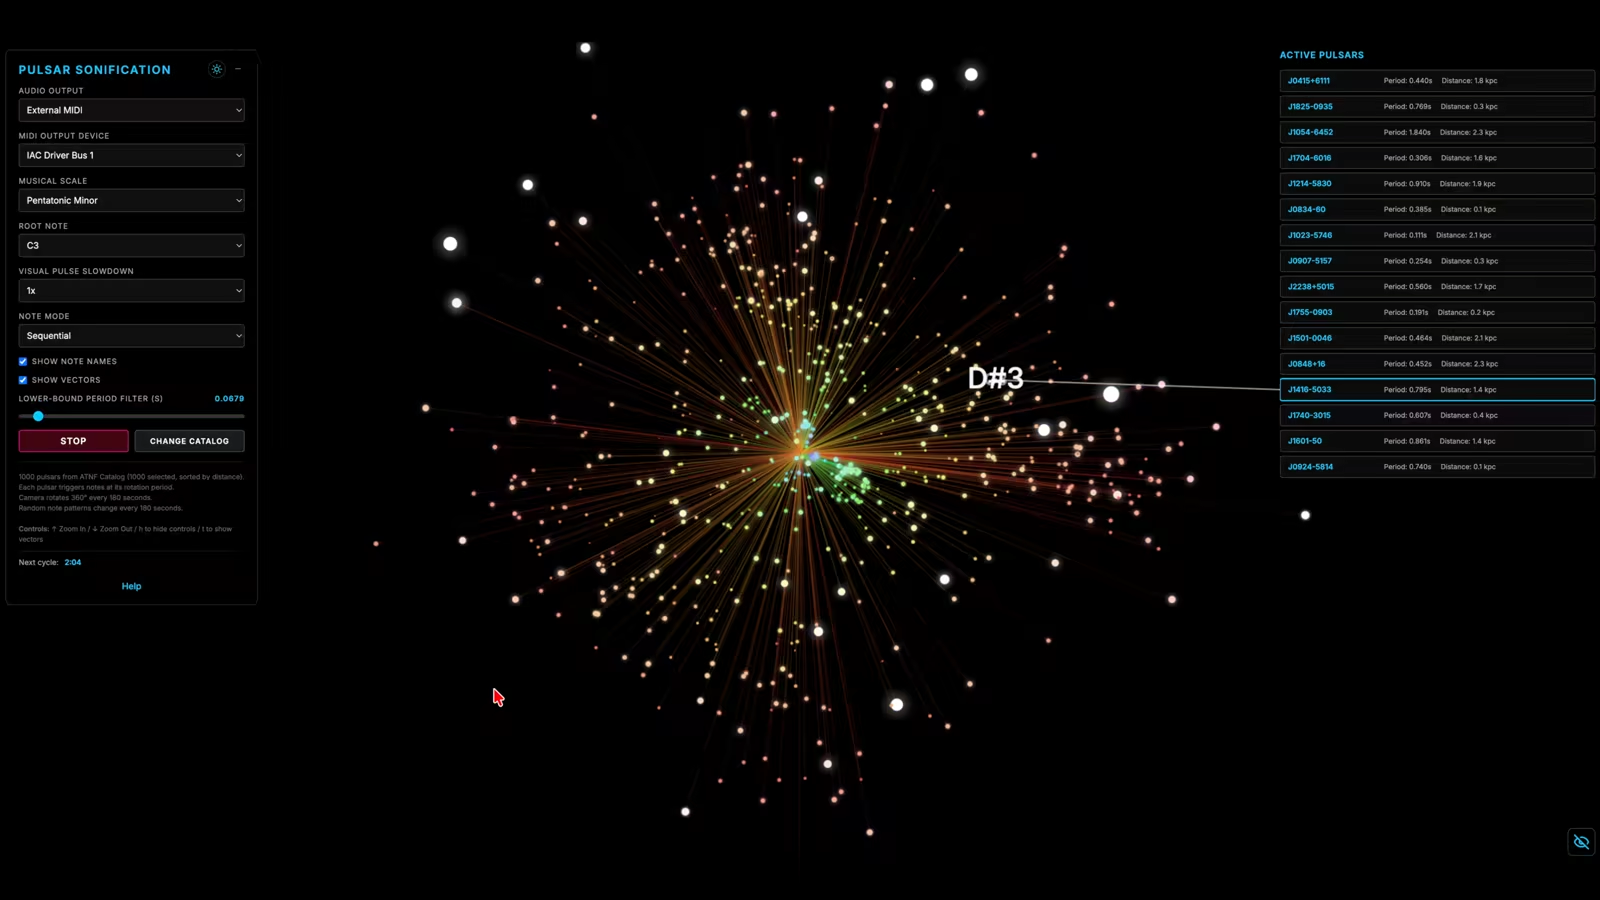
  • Pulsar Sonification plotting a field of pulsars radiating from the galactic centre, one highlighted with the note D sharp 3 and a vector drawn to it, beside a list of active pulsars with their rotation periods and distances in kiloparsecs.

    Pulsar Sonification

    Pulsar timing data, turned into sound

    Pulsars are rotating neutron stars that sweep a beam past Earth with remarkable regularity. This project sonifies their real timing data: the arrival times of those pulses, and the dispersion measures that describe how far the signal has travelled. You can hear the structure in a dataset that is usually only ever plotted.

    Try itpulsar-sonification.netlify.app, try Pulsar Sonification, opens in a new tab
    • Built on real pulsar timing data, not synthesised stand-ins
    • Pulse arrival times drive rhythm; dispersion measure shapes pitch
    • Runs in the browser, with no MIDI hardware required
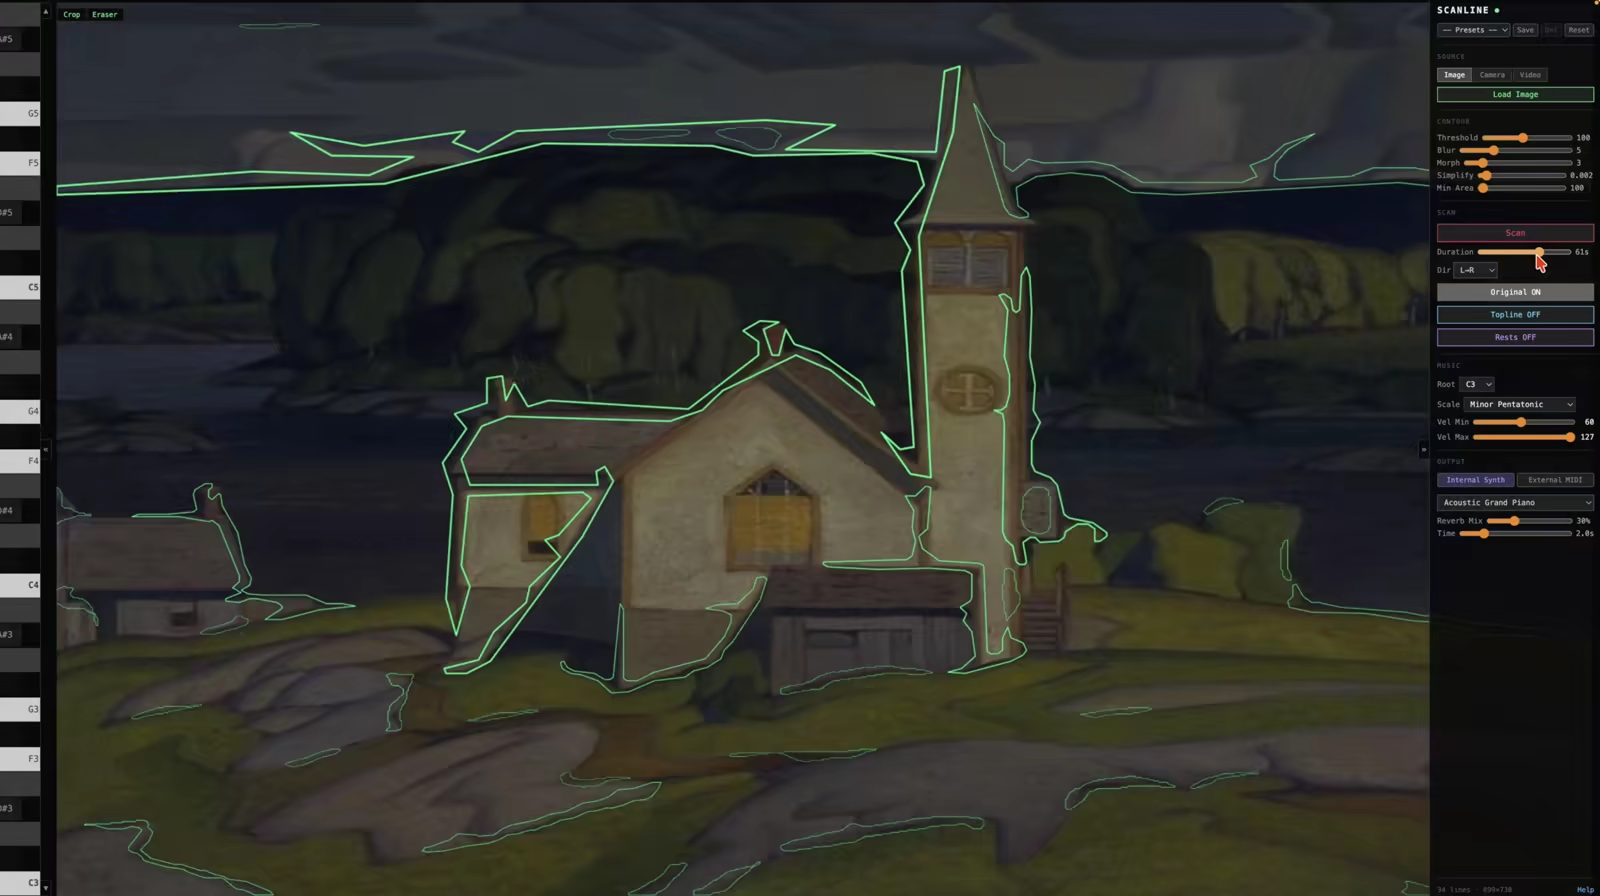
  • Scanline tracing green contours around a church and boathouse in a painting, with a note ladder from C3 upward down the left edge and controls for threshold, scan direction, root note and minor pentatonic scale on the right.

    Scanline

    Hear the outlines in any image

    Scanline translates the contours of an image, video or webcam feed into a musical scale. Where the other tools read colour and movement, this one reads shape. The edges it traces become the notes you hear.

    • Multi-scale contour tracing
    • Works with a still image, a video file, or a live webcam feed
    • Traced outlines are mapped onto a musical scale
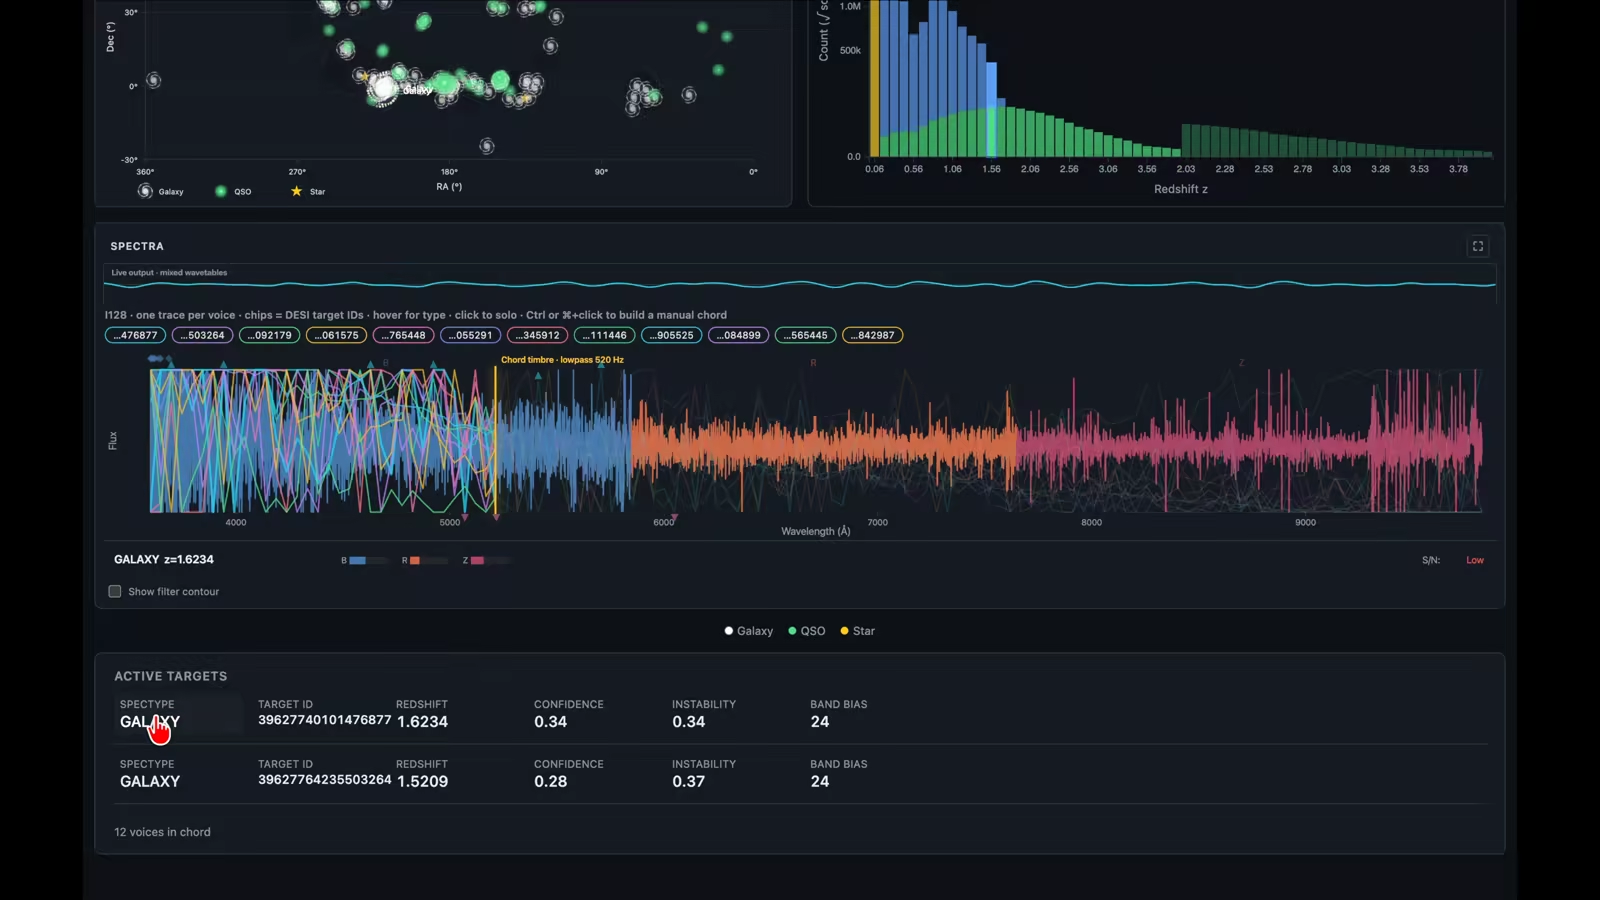
  • DESIsonica showing a sky map of galaxies, quasars and stars plotted by right ascension and declination, a redshift histogram, overlaid spectral traces coloured by band, and a table of active targets with their redshifts and confidence values.

    DESIsonica

    A sky survey you can listen to

    DESIsonica turns astronomical survey data into structured sound with matching visualisations. It draws on Data Release 1 from the Dark Energy Spectroscopic Instrument (DESI), a survey that has measured redshifts for millions of galaxies, quasars and stars, and converts it into bin-triggered spectral wavetable sonification you can explore in a browser.

    • 3D skymap, histogram bins and spectral wavetable views of one dataset
    • All sound generated in the browser, with no MIDI hardware or audio interface
    • A science-aligned approach to sonification
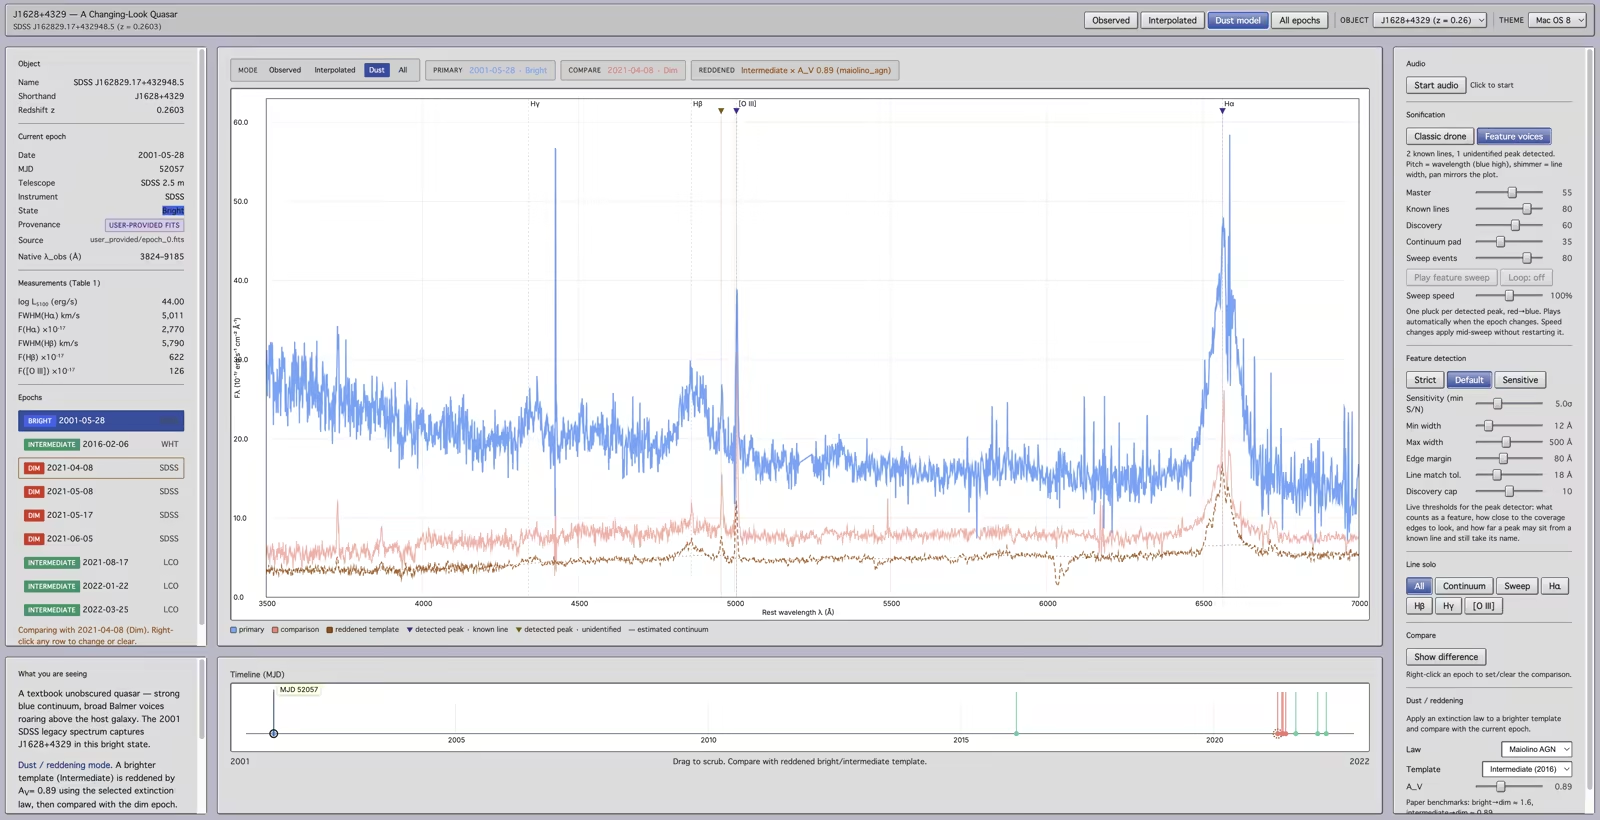
  • SDSS Quasar showing the spectrum of changing-look quasar J1628+4329 at redshift 0.2603, with a bright 2001 trace above dimmer later epochs, the H-gamma, H-beta, O III and H-alpha emission lines marked, an object panel of measurements and a dated epoch list to the left, and sonification controls for feature voices, line solo and dust reddening to the right.

    SDSS-Quasar

    Hear a quasar change its mind

    SDSS Quasar is a browser instrument built from real optical spectra of changing-look quasars, active galactic nuclei whose brightness and spectral shape shift between observations. Scrub through epochs, compare spectra, solo emission lines, or try dust models. The same data plays back as layered sound, with Balmer voices over a continuum chord and filters that darken as obscuration grows. Observed data, interpolations and physical models each carry their own label, so you can explore a quasar in flux without losing track of what is real.

    Try itsdss-quasar.netlify.app, try SDSS-Quasar, opens in a new tab
    • Real optical spectra of changing-look quasars, scrubbed epoch by epoch
    • Balmer voices and a continuum chord layered from the same reading
    • Observed data, interpolations and physical models each labelled
  • SourceDESI Data Release 1, Dark Energy Spectroscopic Instrument
  • SourceSDSS, Sloan Digital Sky Survey — optical spectra

Input

Something else you want heard?

If the phenomenon you have in mind isn’t on this page, it is probably still readable. Tell us what it is.

Output

Standard MIDI

Get in Touch